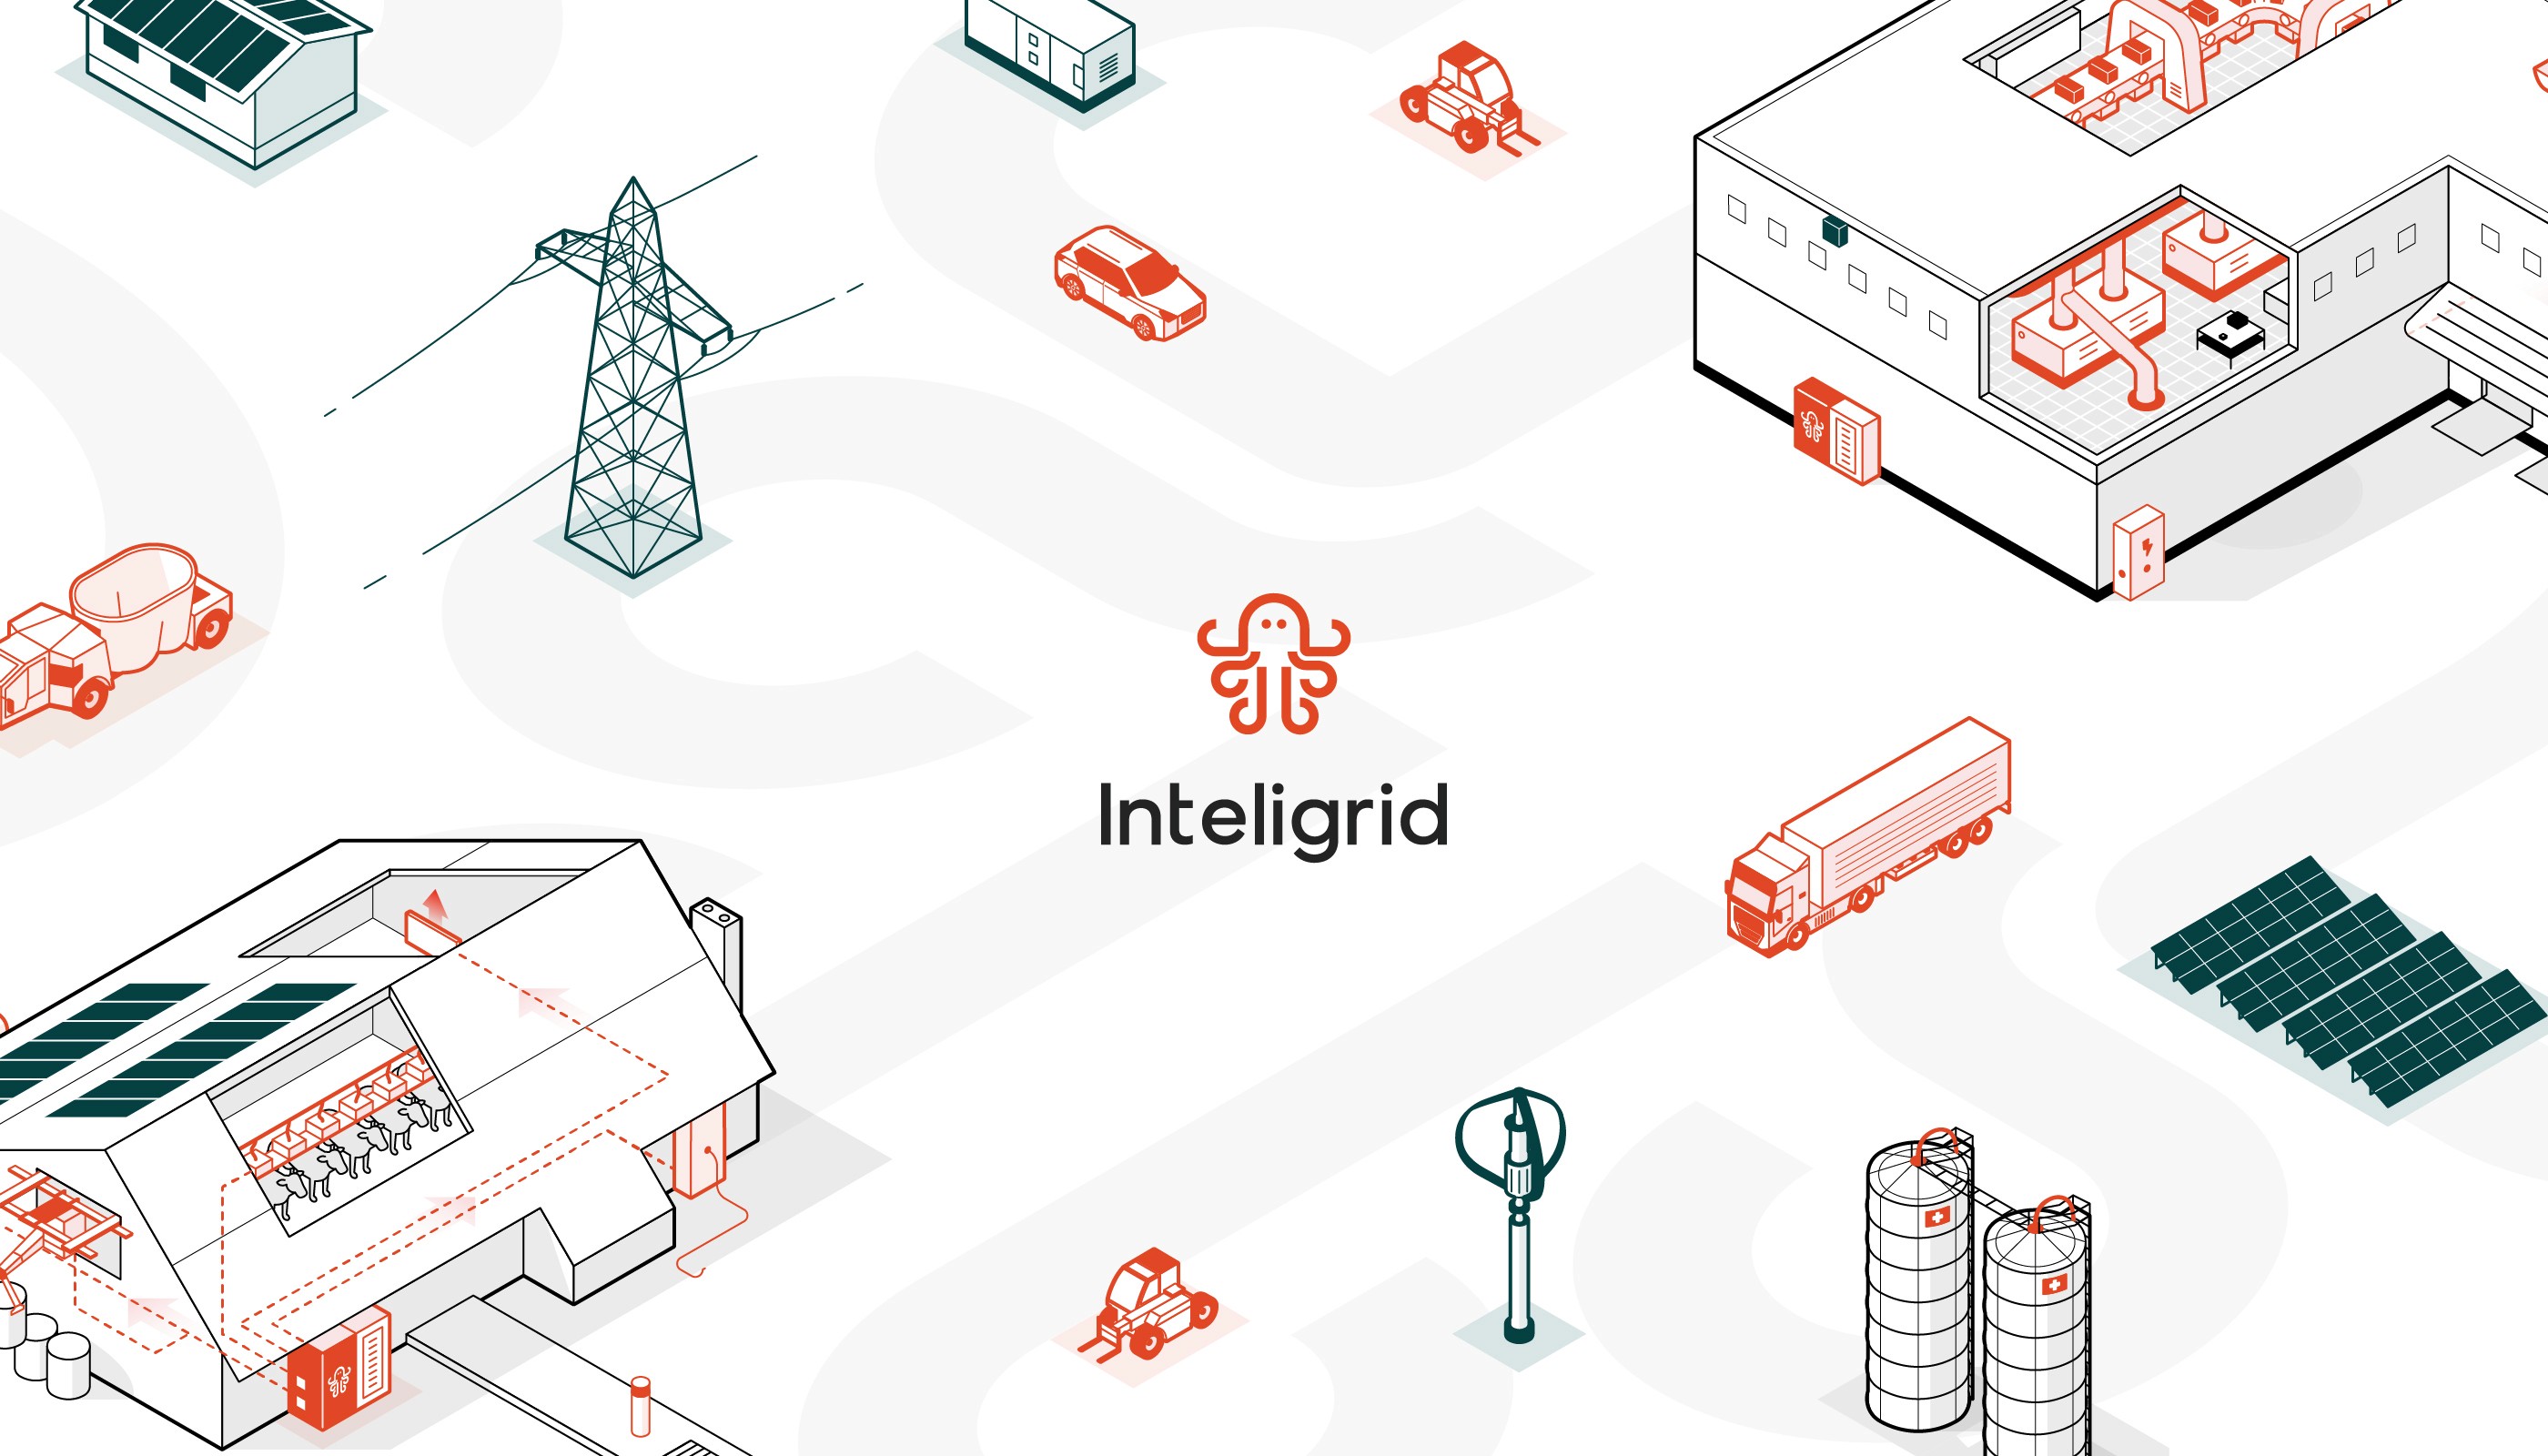
A set of detailed isometric illustrations was designed to visualize complex smart power distribution systems for Inteligrid. The goal was to clearly explain the interactions between energy generation, storage, and consumption on modern farm and industrial sites. The clean, blueprint-like aesthetic uses a limited color palette to highlight key components and energy flows, creating a visual language that is both technically precise and easy to understand.
illustration
isometric style
vector graphic
data visualization




Next project